This is the second post of a series on US Equity Market Structure (a total of 6).
I didn’t write any of these posts; while I was learning the fundamentals about investment, I came across this series on Interactive Brokers’ IBKRCampus. If you are interested you can go to their site here.
(Disclosure: I’m using Interactive Brokers for my personal investing, but I’m not paid by them to write about it.)
This series is mostly platform-agnostic, meaning that you don’t have to be on Interactive Brokers to find this series useful. Enjoy.
Thanks for coming back for lesson two in our course on equity market structure. In our last lesson, we talked about the US equity market’s rulebook and the regulators—the laws, regulations, and regulators that govern the broad structures for trading. Today, we’re talking about the exchanges and other trading venues.
These entities, which are for-profit in the U.S., play two roles: trading venues act as the playing field and referees for trading. They have rules and technology that set up the basic boundaries for how they will match buyers and sellers. Their playing fields must be set up within the confines of the Exchange Act, but beyond that, they have some leeway with how trading works on their particular exchange.
For instance, IEX is known for its “speed bump”—a coil of cable that delays all messages coming in and out of the exchange by 350 microseconds. Trading venues are also responsible for monitoring trading on their venue for, among other things, potentially manipulative activity.
So, where are these entities that have so much power over how trading happens?
Stock Exchanges: Three Exchange Families Plus IEX
Stock exchanges are the main places where trading gets done. As of the recording of this lesson, there are 13 stock exchanges in the US, but that number makes it sound more complicated than it is. There are actually only four stock exchange operators currently in the market.
The New York Stock Exchange (NYSE) was the first US equities exchange. It still exists today and is often called “NYSE Classic” as shorthand. It’s the exchange that lists companies like GE and DuPont. However, NYSE also owns four other stock exchanges: NYSE Arca, which mainly lists ETFs, and three smaller exchanges with less than 1% market share: NYSE Chicago (the former Chicago Stock Exchange), NYSE American (the former American Stock Exchange), and NYSE National (the former Cincinnati Stock Exchange).
Next, there’s Nasdaq, which was founded in the 1970s as the first fully electronic stock market and became an exchange in 2006, ahead of Regulation NMS, which we discussed in the previous lesson. Nasdaq’s main exchange, just called Nasdaq, currently handles the most trading of any exchange and lists companies like Microsoft and Apple. Nasdaq also owns Nasdaq BX (the former Boston Stock Exchange) and Nasdaq PSX (the former Philadelphia Stock Exchange).
Then there’s Cboe Global Markets, the company that bought Bats Global Markets. Bats was founded in 2005 and started two exchanges. In 2014, it merged with Direct Edge, which also had two exchanges. Those four exchanges, which are now part of Cboe, are called Cboe BYX, Cboe BZX, Cboe EDGA, and Cboe EDGX.
Finally, there’s the Investors Exchange (IEX). IEX became an exchange in 2016 and is most well-known for the speed bump mentioned previously, which is designed to help the exchange ensure it has the most up-to-date prices from around the market before executing trades. IEX has also introduced other technology and business practices that are designed to level the playing field for all participants.
All the stock exchanges have applied for and received permission from the SEC to be what is called nationally registered stock exchanges. In this capacity, they are considered self-regulatory organizations (SROs) that have significant power to enforce the rules of their exchanges, acting as referees. However, with that power comes a large amount of scrutiny and regulatory oversight, aimed at ensuring that the exchanges operate with a high degree of integrity, security, and precision.
In addition to these exchanges, there are a number of other companies that may be launching exchanges in the near future, including the Long-Term Stock Exchange, the Members Exchange, and MIAX, which is known for operating multiple options exchanges. It’s a constantly evolving landscape and one that you can follow in the news regularly.
Alternative Trading Systems (ATS) – AKA Dark Pools
In addition to the stock exchanges, trading also occurs on Alternative Trading Systems (ATSs), often referred to as dark pools. These venues have the same fundamental rules but exhibit some critical differences. ATSs are more lightly regulated marketplaces for trading, often run by large banks. For instance, two of the largest dark pools are run by UBS and Morgan Stanley. However, some ATSs are run independently, such as Liquidnet.
ATSs are called dark pools because, in many cases, they only offer non-displayed trading, meaning buyers and sellers don’t publicly post or advertise the prices at which they would be willing to trade. Instead, they submit their orders to the dark pool and wait for another order to match with them. Non-displayed trading is also available on exchanges but tends to be more prevalent on ATSs.
Starting soon, dark pools will have to disclose the rules of how trading works on their venues publicly via a form called ATS-N. This is important because the way dark pools operate is more flexible than exchanges. For example, they can charge more for trading than exchanges. Additionally, after trades occur on dark pools, they are only reported publicly as occurring off-exchange and are not attributed to the specific dark pool where they occurred.
Internalization
Finally, trades can also be executed inside large brokerages, for example, by matching or internalizing two customers’ orders. Large banks often work with a lot of clients across various departments. If they receive one order to buy and one order to sell the same stock, they can match those orders internally rather than sending them to an exchange or dark pool. Brokers prefer this because they get two orders filled immediately without sharing any information with the broader market, and they don’t have to pay another entity to execute the trade.
Additionally, some brokers send orders to market-making firms (also known as wholesalers) who trade against the orders for their own accounts. This process is also referred to as internalization.
In the next lesson, we’ll talk about what is actually traded in the US equity markets: stocks.
This is the first post of a series on US Equity Market Structure (a total of 6).
I didn’t write any of these posts; while I was learning the fundamentals about investment, I came across this series on Interactive Brokers’ IBKRCampus. If you are interested you can go to their site here.
(Disclosure: I’m using Interactive Brokers for my personal investing, but I’m not paid by them to write about it.)
This series is mostly platform-agnostic, meaning that you don’t have to be on Interactive Brokers to find this series useful. Enjoy.
Welcome to Introduction to the US Equity Market Structure, presented by the Investors Exchange. In this course, we’ll be providing an overview of how the US equities landscape is structured in order to give you an understanding of how your orders end up being executed in the market.
The image some people have in their minds of a trading floor with humans shouting orders no longer reflects how trading actually works. Our aim is for you to better understand the reality of the US equities market so you can make informed decisions about how you trade.
In this course, we compare the equity markets to a sport, with rules, referees, a playing field, a ball, and players on the field. While it’s not a perfect analogy, it’s a good way to understand many of the dynamics in the market. We hope that this approach will be helpful for you and encourage you to reach out to IEX with your comments and questions after you finish the course. In the meantime, put on your cap, lace up your cleats, and join us on the field.
The most important part of understanding any sport is, of course, the rules. What’s the goal of the game? What’s allowed? And how are the rules enforced?
The Purpose of the Stock Market: The Exchange Act of 1934
The oldest stock exchange in the US, the Philadelphia Stock Exchange, was founded in 1790, followed by a number of other regional exchanges. However, the foundation of our modern US equity market, the way it looks today, was really laid out in a key piece of legislation that came out of the public crisis of faith in the public markets following the stock market crash of 1929: the Exchange Act of 1934.
The Exchange Act of 1934 created the Securities and Exchange Commission, known as the SEC, and regulates the trading of stocks and bonds. In creating the SEC, the Exchange Act gave it broad authority over the securities industry. It is because of this law that the SEC can make rules that govern how brokers, exchanges, and other entities can operate and enforce those rules. It also outlines certain trading activities, like insider trading, as illegal, and established the practice of regular corporate reporting.
This ensures that when investors buy stock in a business, they know that every quarter, they will get an update on the business, which they can then use to make an informed decision on whether they want to continue to own that stock moving forward. It’s like a rule in a sport saying that everyone has to be able to see where the ball is—no one can be forced to wear a blindfold.
The Exchange Act also established the role of stock exchanges, which are known as self-regulatory organizations. We’ll talk more about the exchanges in the next lesson, but what the Exchange Act says about exchanges reveals a lot about the playing field they were putting in place. The Act says the rules of the exchange are designed to prevent fraudulent and manipulative acts and practices, to promote just and equitable principles of trade, to foster cooperation and coordination with persons engaged in regulating, clearing, settling, processing information with respect to, and facilitating transactions in securities, to remove impediments to and perfect the mechanism of a free and open market and a national market system, and in general, to protect investors and the public interest.
The Regulators: SEC and FINRA
We’ve talked a bit about the SEC already through the lens of the Exchange Act of 1934, but what does it really mean that the SEC regulates the securities industry? The SEC is the governing body of the securities space. Their mission is to protect investors, maintain fair, orderly, and efficient markets, and facilitate capital formation.
In that capacity, the SEC has the power to make new rules about how trading works, just like an organization like the International Football Association Board can make adjustments to the rules of soccer. For instance, as technology has changed how people trade, the SEC has updated its rules to account for things like computer-based trading.
The SEC also has an enforcement division that brings civil enforcement actions against companies and individuals who violate securities laws. In this capacity, the SEC is like the NBA commissioner who has the power to hand down disciplinary actions to players who break the rules of the game.
The Financial Industry Regulatory Authority, known as FINRA, is an independent nonprofit authorized by Congress to protect investors. It’s not part of the government, but like the exchanges, it’s a self-regulatory organization that has delegated authority. FINRA is focused specifically on the broker-dealer industry and has the power to write and enforce rules that brokers have to follow, examining firms for compliance with those rules and disciplining firms that have violated the rules.
The Regulatory Landscape: Reg NMS, Order Protection Rule, Access Rule, Penny Rule, Market Data Rules
While many aspects of the trading landscape have stayed the same over the years, trading today obviously looks very different than it did 50 years ago. Like virtually all aspects of our lives, trading has been massively changed by the development of technology, and regulation has had to change with it.
The most influential regulation that has shifted the way trading works today is a 2005 consolidation of earlier legislation known as Regulation National Market System (Reg NMS). You can think of this regulation and its impact as similar to when the designated hitter rule was adopted by the American League in baseball in 1973, or when the 24-second shot clock was introduced in basketball.
The period before the institution of Reg NMS was a time of tremendous change for the market. The market had transitioned from being dominated by the New York Stock Exchange to being extremely fragmented, with stocks trading at different prices with no central source of truth. Reg NMS set out to stitch the market together into one national market system. In doing so, it made several changes that have forever altered the dynamics of trading.
First, the Order Protection Rule. This rule requires that you can’t trade at a worse price if a better price is available and accessible in the market. So, if you’re buying a stock and it’s available for $9.99 on one exchange, you can’t buy it for $10 on a different exchange. It’s like an “out of bounds” play.
Second, the Access Rule. The Access Rule ensured that different trading venues were connected to each other and lowered the prices they could charge for trading to make sure people could access them. This rule aimed to prevent gaming of the Order Protection Rule by putting a cap on prices. It ensures that an exchange can’t charge a ridiculous amount to trade and then require that you pay it just because they have the best price.
Next, the Sub-Penny Rule. This rule set the minimum price increment for a stock at one cent for stocks priced over one dollar. This is why you’ll never see a stock for sale at the kinds of prices you see at gas stations, like $3.5999.
Finally, the Market Data Rules. These rules created advisory committees populated by the exchanges that determine how exchanges distribute market data and provided a new mechanism for how they could be paid for this work.
Since 2005, these rules have been applied and interpreted in many ways. We’ll see their impact throughout the rest of this course. In the next lesson, we’ll dig further into the stock exchanges and how they both establish the playing fields for trading and act as its immediate referees.
The three financial statements – balance sheet, income statement, and cash flow statement – reflect two perspectives. The first perspective is what the cash flow statement reflects, which is whether a company can sustain its business in the future, or its risk. The second perspective is what the combination of balance sheet and income statement represent: if the company can sustain its business, what the business will look like. In other words, it is the perspective of returns.
In our previous discussions of the paper manufacturers, we were actually assuming there were no operational risks, meaning that we assumed that these companies had no survival risks. However, we know that this is not true in the real world, so we will discuss the analysis of cash flow statement and learn how to understand the information on cash flow statement.
First of all, let’s recall what cash flow statement looks like. As we said, the cash flow statement describes the flow of cash. It is related to three types of activities of a company, or operation, investment, and financing. Under these three types of activities, the statement describes the inflow and outflow of cash. We have covered the detailed concepts of each type of cash flow in a previous episode which can be found here.
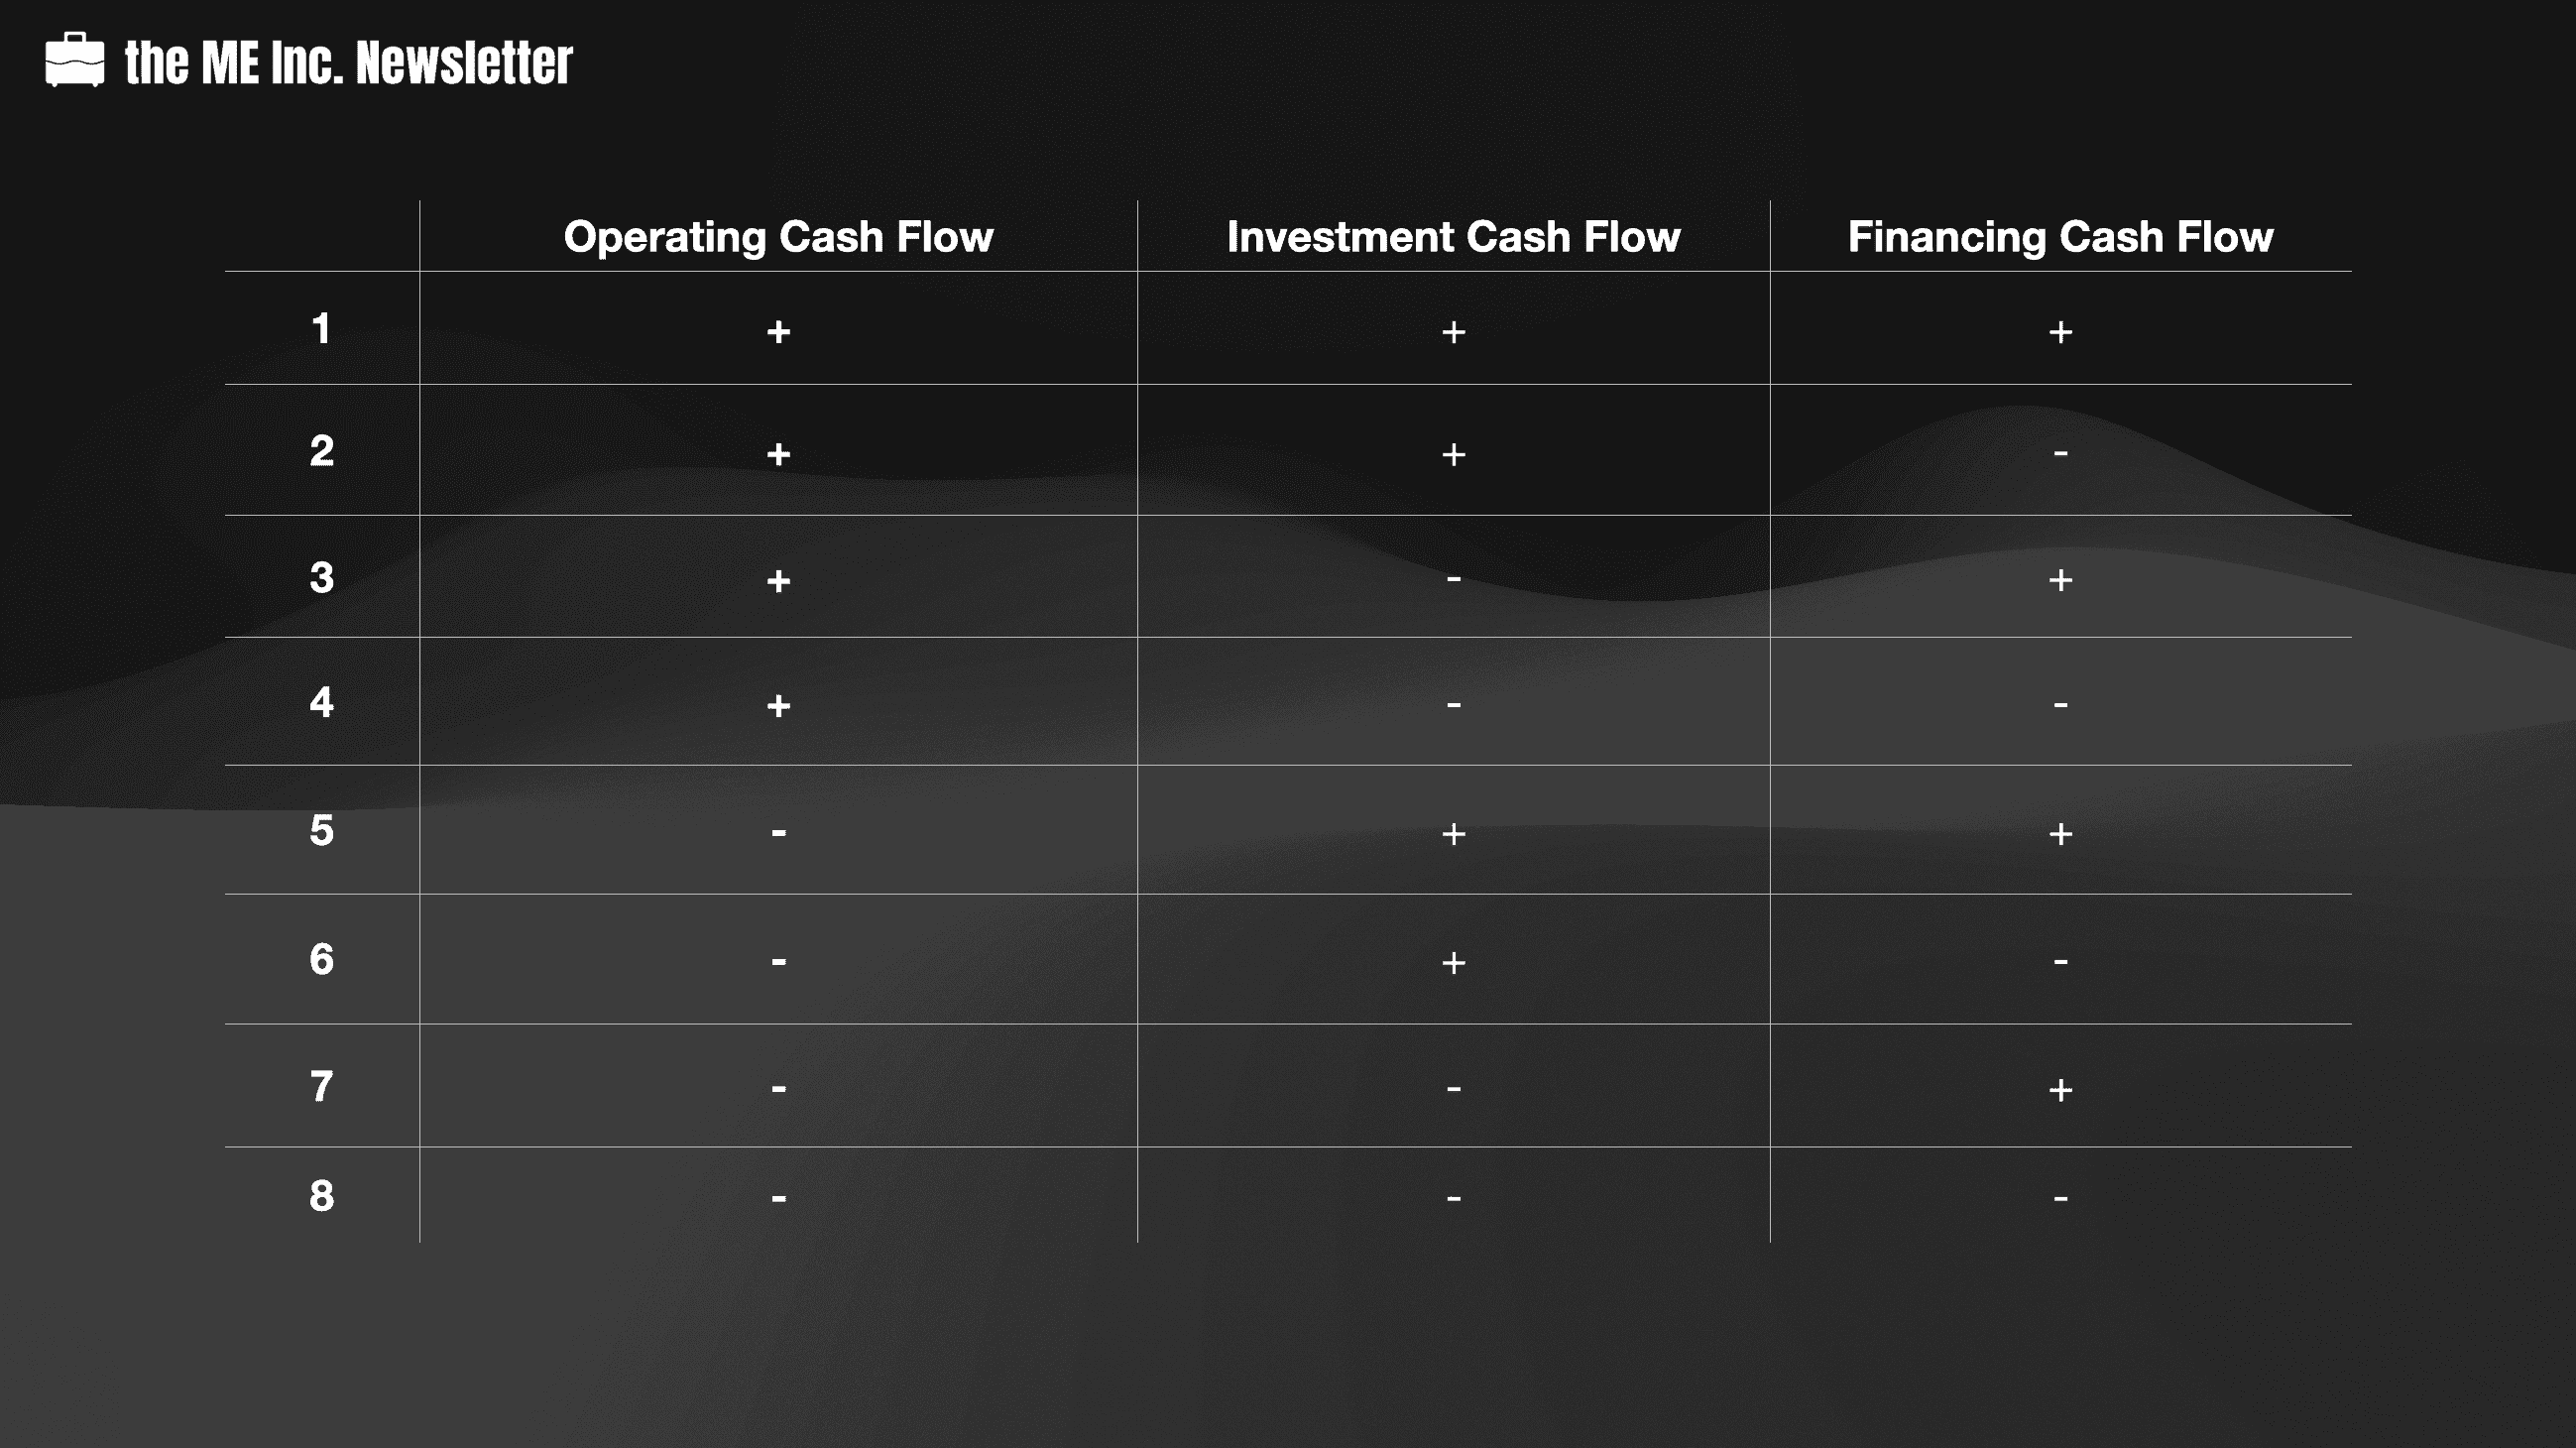
For the cash flow statement, the ultimate net cash flow is the total cash inflow minus the total cash outflow.
This table illustrates the possible combinations of a company’s net cash flows for each type of economic activity.
Recall that the reason we want to understand the detailed changes for each type of economic activity is that the final net cash flow of the company is not that important; after all, we can get the same number from the balance sheet alone, i.e. by looking at the cash balance difference between last year and this year. In short, we want to understand the reason for a company’s cash outflow and inflow. So let’s discuss how to interpret components in the cash flow statement.
For each type of cash flow, the net result could either be a net inflow or a net outflow. A net inflow is represented by a plus sign, while a net outflow is represented by a minus sign. All possible combinations are documented in the table above. Now let’s discuss them one by one (not necessarily from the first to the last).
Let’s first look at the second combination. What does a company that has a positive operating cash flow, a positive investment cash flow, and a negative financing cash flow look like?
+ Operating Cash Flow
Having a positive operating cash flow means the money earned from selling products is enough to cover for its procurement, wages and taxes, etc. In other words, the company’s operating activities are self-sufficient, or itcan generate blood for itself.
+ Investment Cash Flow
We see the cash flow of investment of the company is positive. What this means is that the company has net cash inflow from investment.
A company may generate positive investment cash flow from disposal of asset or cash from returns of investment. Generally speaking, it is more likely that such cash comes from returns of investment, considering that the operating activities of the company is also generating positive cash flow itself, so it should not need to dispose of its assets.
– Financing Cash Flow
The company’s financing activities are generating negative cash flow for the reason that the company may be paying back money to banks, or paying dividends to shareholders.
Summary
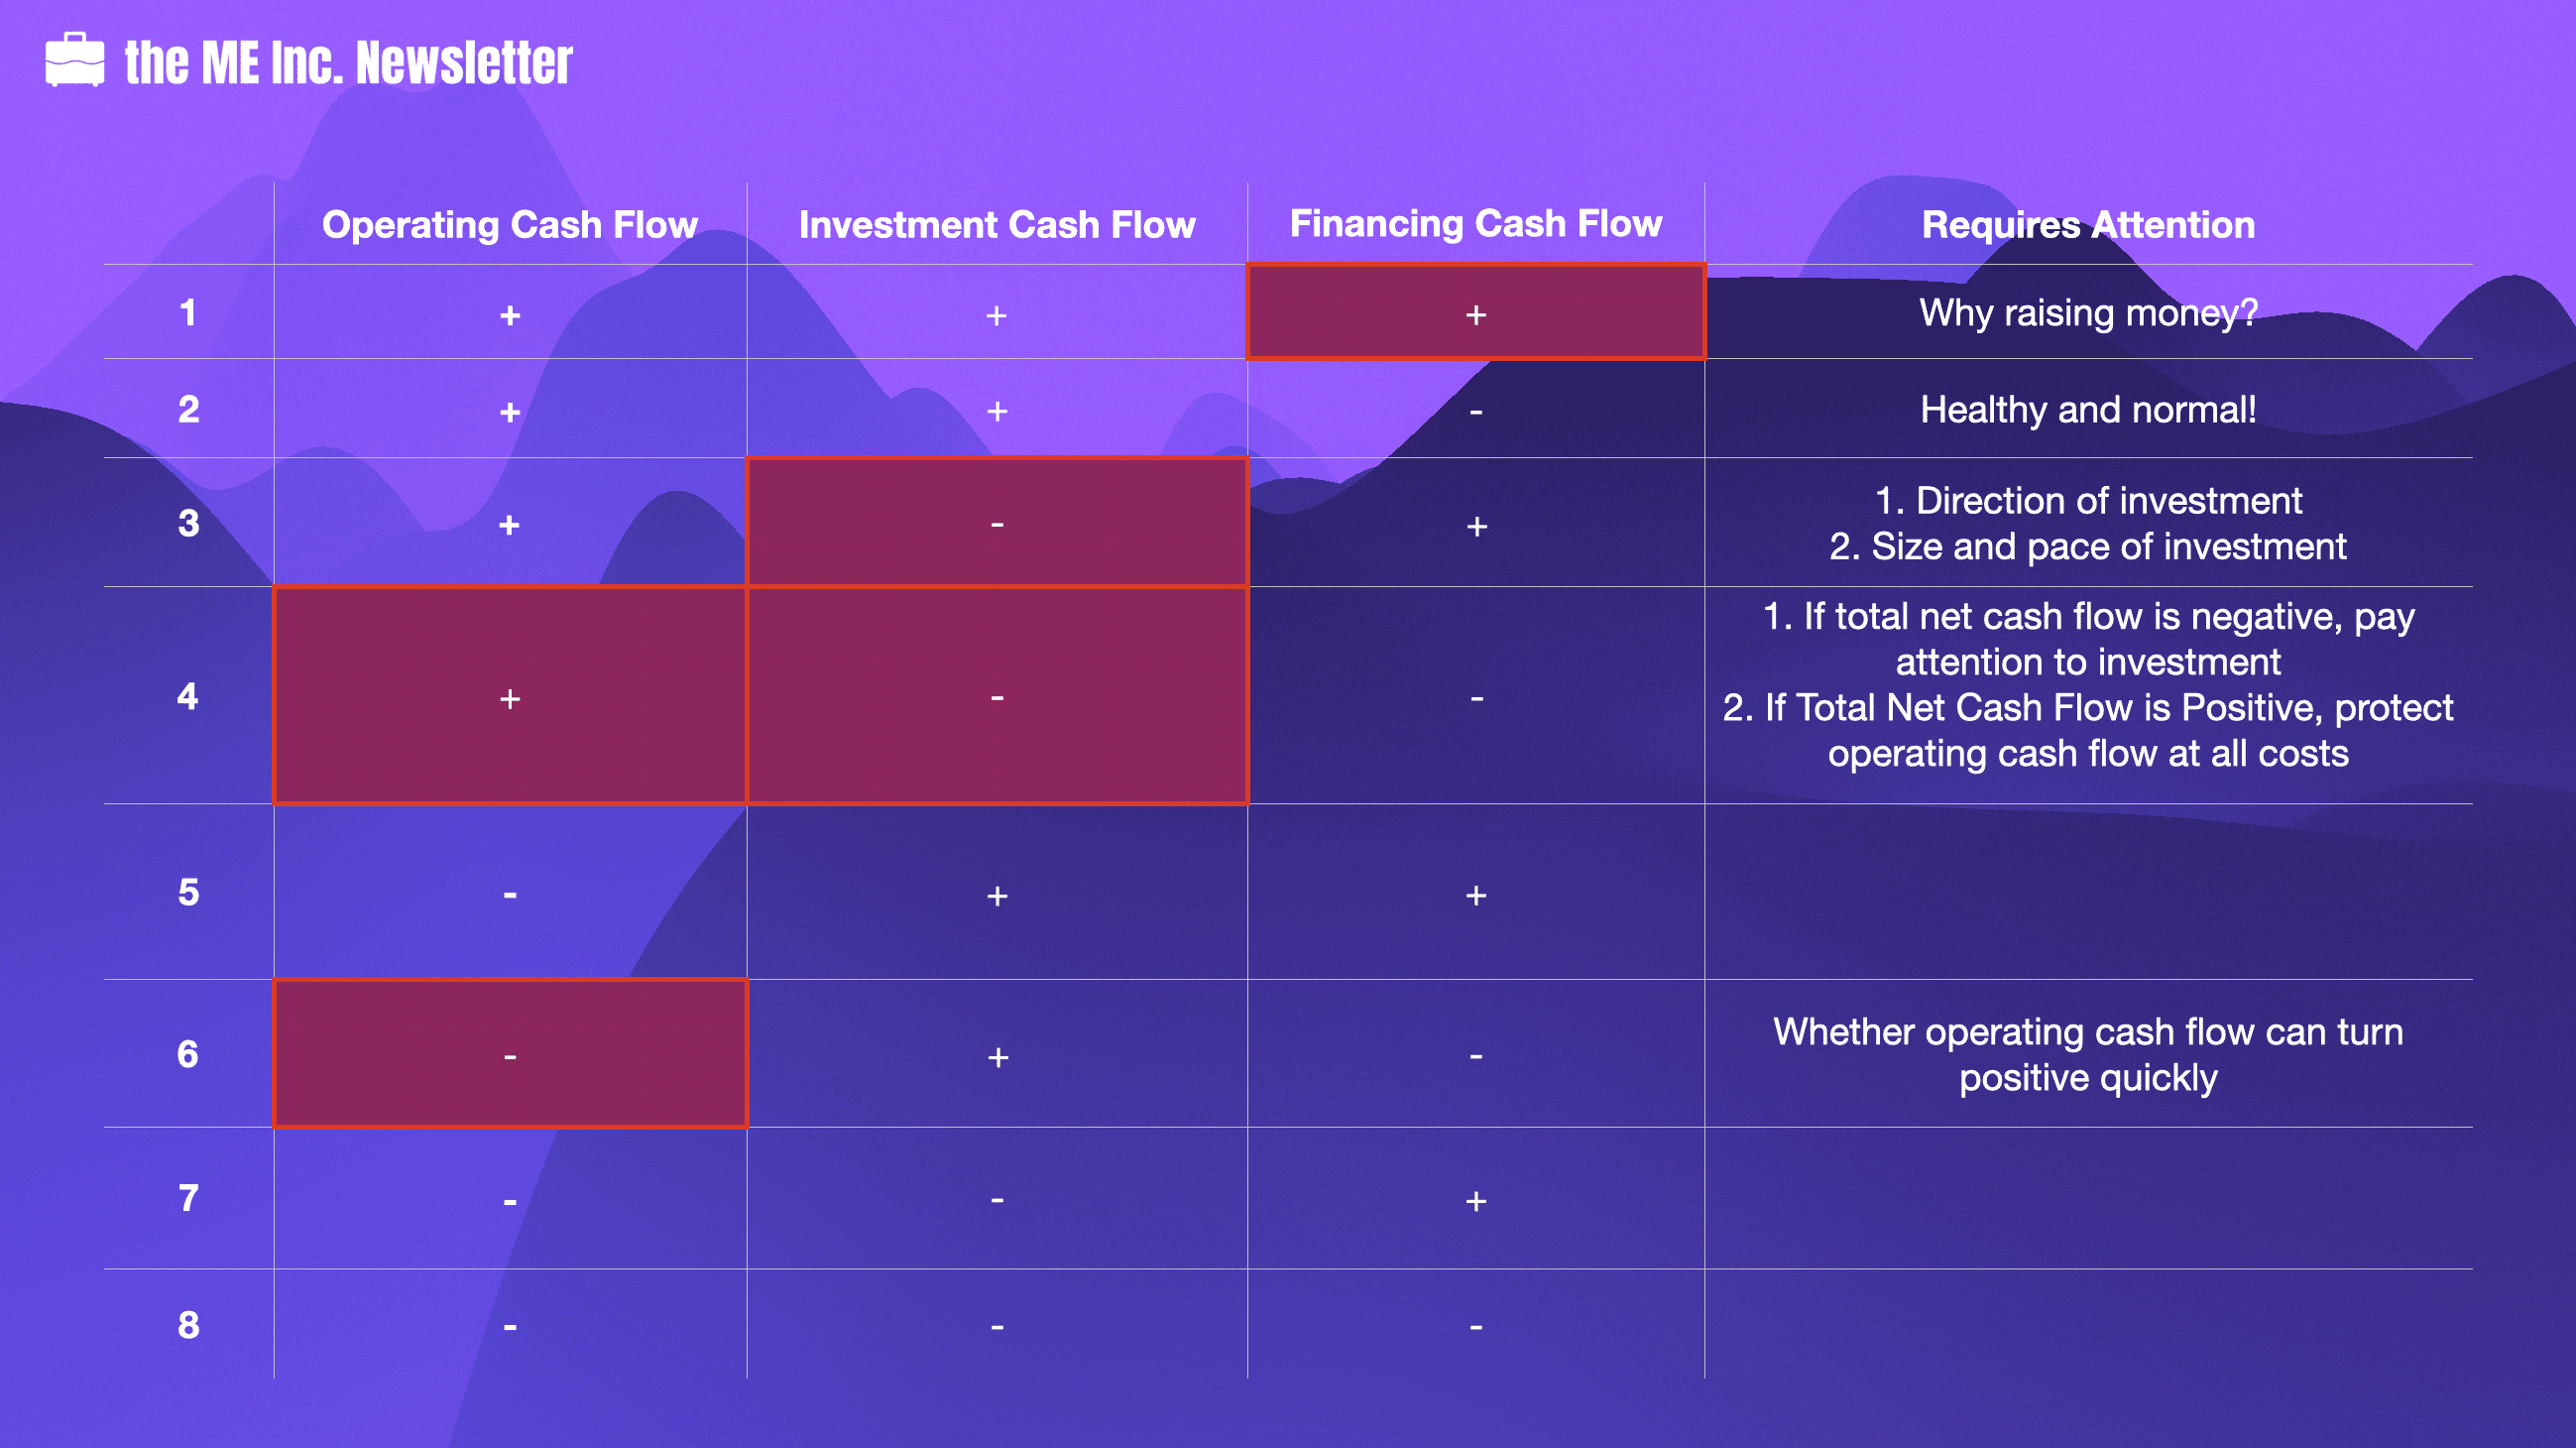
In short, the company’s cash flow is healthy and normal. The company’s operating activities are quite healthy. Its investment has made some returns, and this company spends some money on paying loans to banks or paying dividends to shareholders. The company might be in a mature stage.
The only difference between the first and the second combination is that the first combination has a positive financing cash flow.
What this means is that the company is taking in financing money, or raising money.
Why should a mature, healthy company with normal operations be raising money? And where could the company spend such money?
One possibility is that the company plans to invest in a certain area, so it needs money. But if we look at this company, the company actually has a positive investment cash flow. What it means is that at least at this stage, the company hasn’t made large-scale investments, which will cause large cash outflows. As soon as the company starts to make such large investments, its investment cash flow will turn from positive to negative, which is represented in the third combination.
But what if the company has no such investment plans? Why should such a mature company be financing? If it doesn’t have a big plan of investment, there is no reason that it should need more money.
In reality, however, companies do raise money even when they don’t have investment plans. The reason could be multifaceted. For example, in China private companies’ financing methods are quite limited. So when a company is running smoothly and has enough money, it actually is in a better position to get loans from banks. The company will seize such opportunity to secure as much loans from the banks as possible, since such opportunity is hard to encounter. Of course, we cannot rule out the possibility that some companies have bad motives when raising money without specific investment options. For example, it may want to transfer such money to some affiliated companies.
Overall, a company with positive cash flows in all three types of economic activities requires more attention. We should at least ask the purpose of it financing, and how the company expects such financing to impact the future of the company. Regardless of whether the company is raising money because its financing channels are limited, or because it has ill reasons, such financing activity will dilute the profitability of the company.
Like we said, the company with the 1st combination of cash flows could soon become one with the third after it executes on its investment plan. The company’s operating activities are completely self-sufficient; at the same time, it needs more money for investment.
What do you think is the biggest concern of this company?
Investment. Why?
Well this company is likely using money from operating and financing activities for investment. The success of investment could literally make or break this company. There have been numerous cases where a healthy and successful company goes into bankruptcy because of just one investment failure.
The first thing off the top of our minds is when a company decides to invest in unrelated businesses, fails, and never recovers from such failure. However, even when a company stays in its main business and invest, the success of investments is no guarantee. For instance, there was a very famous company in the instant noodle business. This company created the concept of non-fried instant noodles, which are thought of as more healthy. Because of such a healthy concept, the company quickly became one of the five largest instant noodle makers in China.
To maintain such level of success, the company began to invest heavily in production capacity expansions. Its investment was made in its main business, not diversified lines of businesses. Considering that its main business is going so well, such investment can actually be considered as low-risk.
However, the final result was pretty sad. When the company went bankrupt because of a breakdown of cash flow, there was only 3,000 CNY in its bank account. Apparently the company’s cash flow completely broke down. How could such a situation happen?
As a matter of fact, even when the company went bankrupt, its main line of business was still doing quite well. Its market share was well maintained, and the accounts receivable were still being collected. Then why does such a company end up like this?
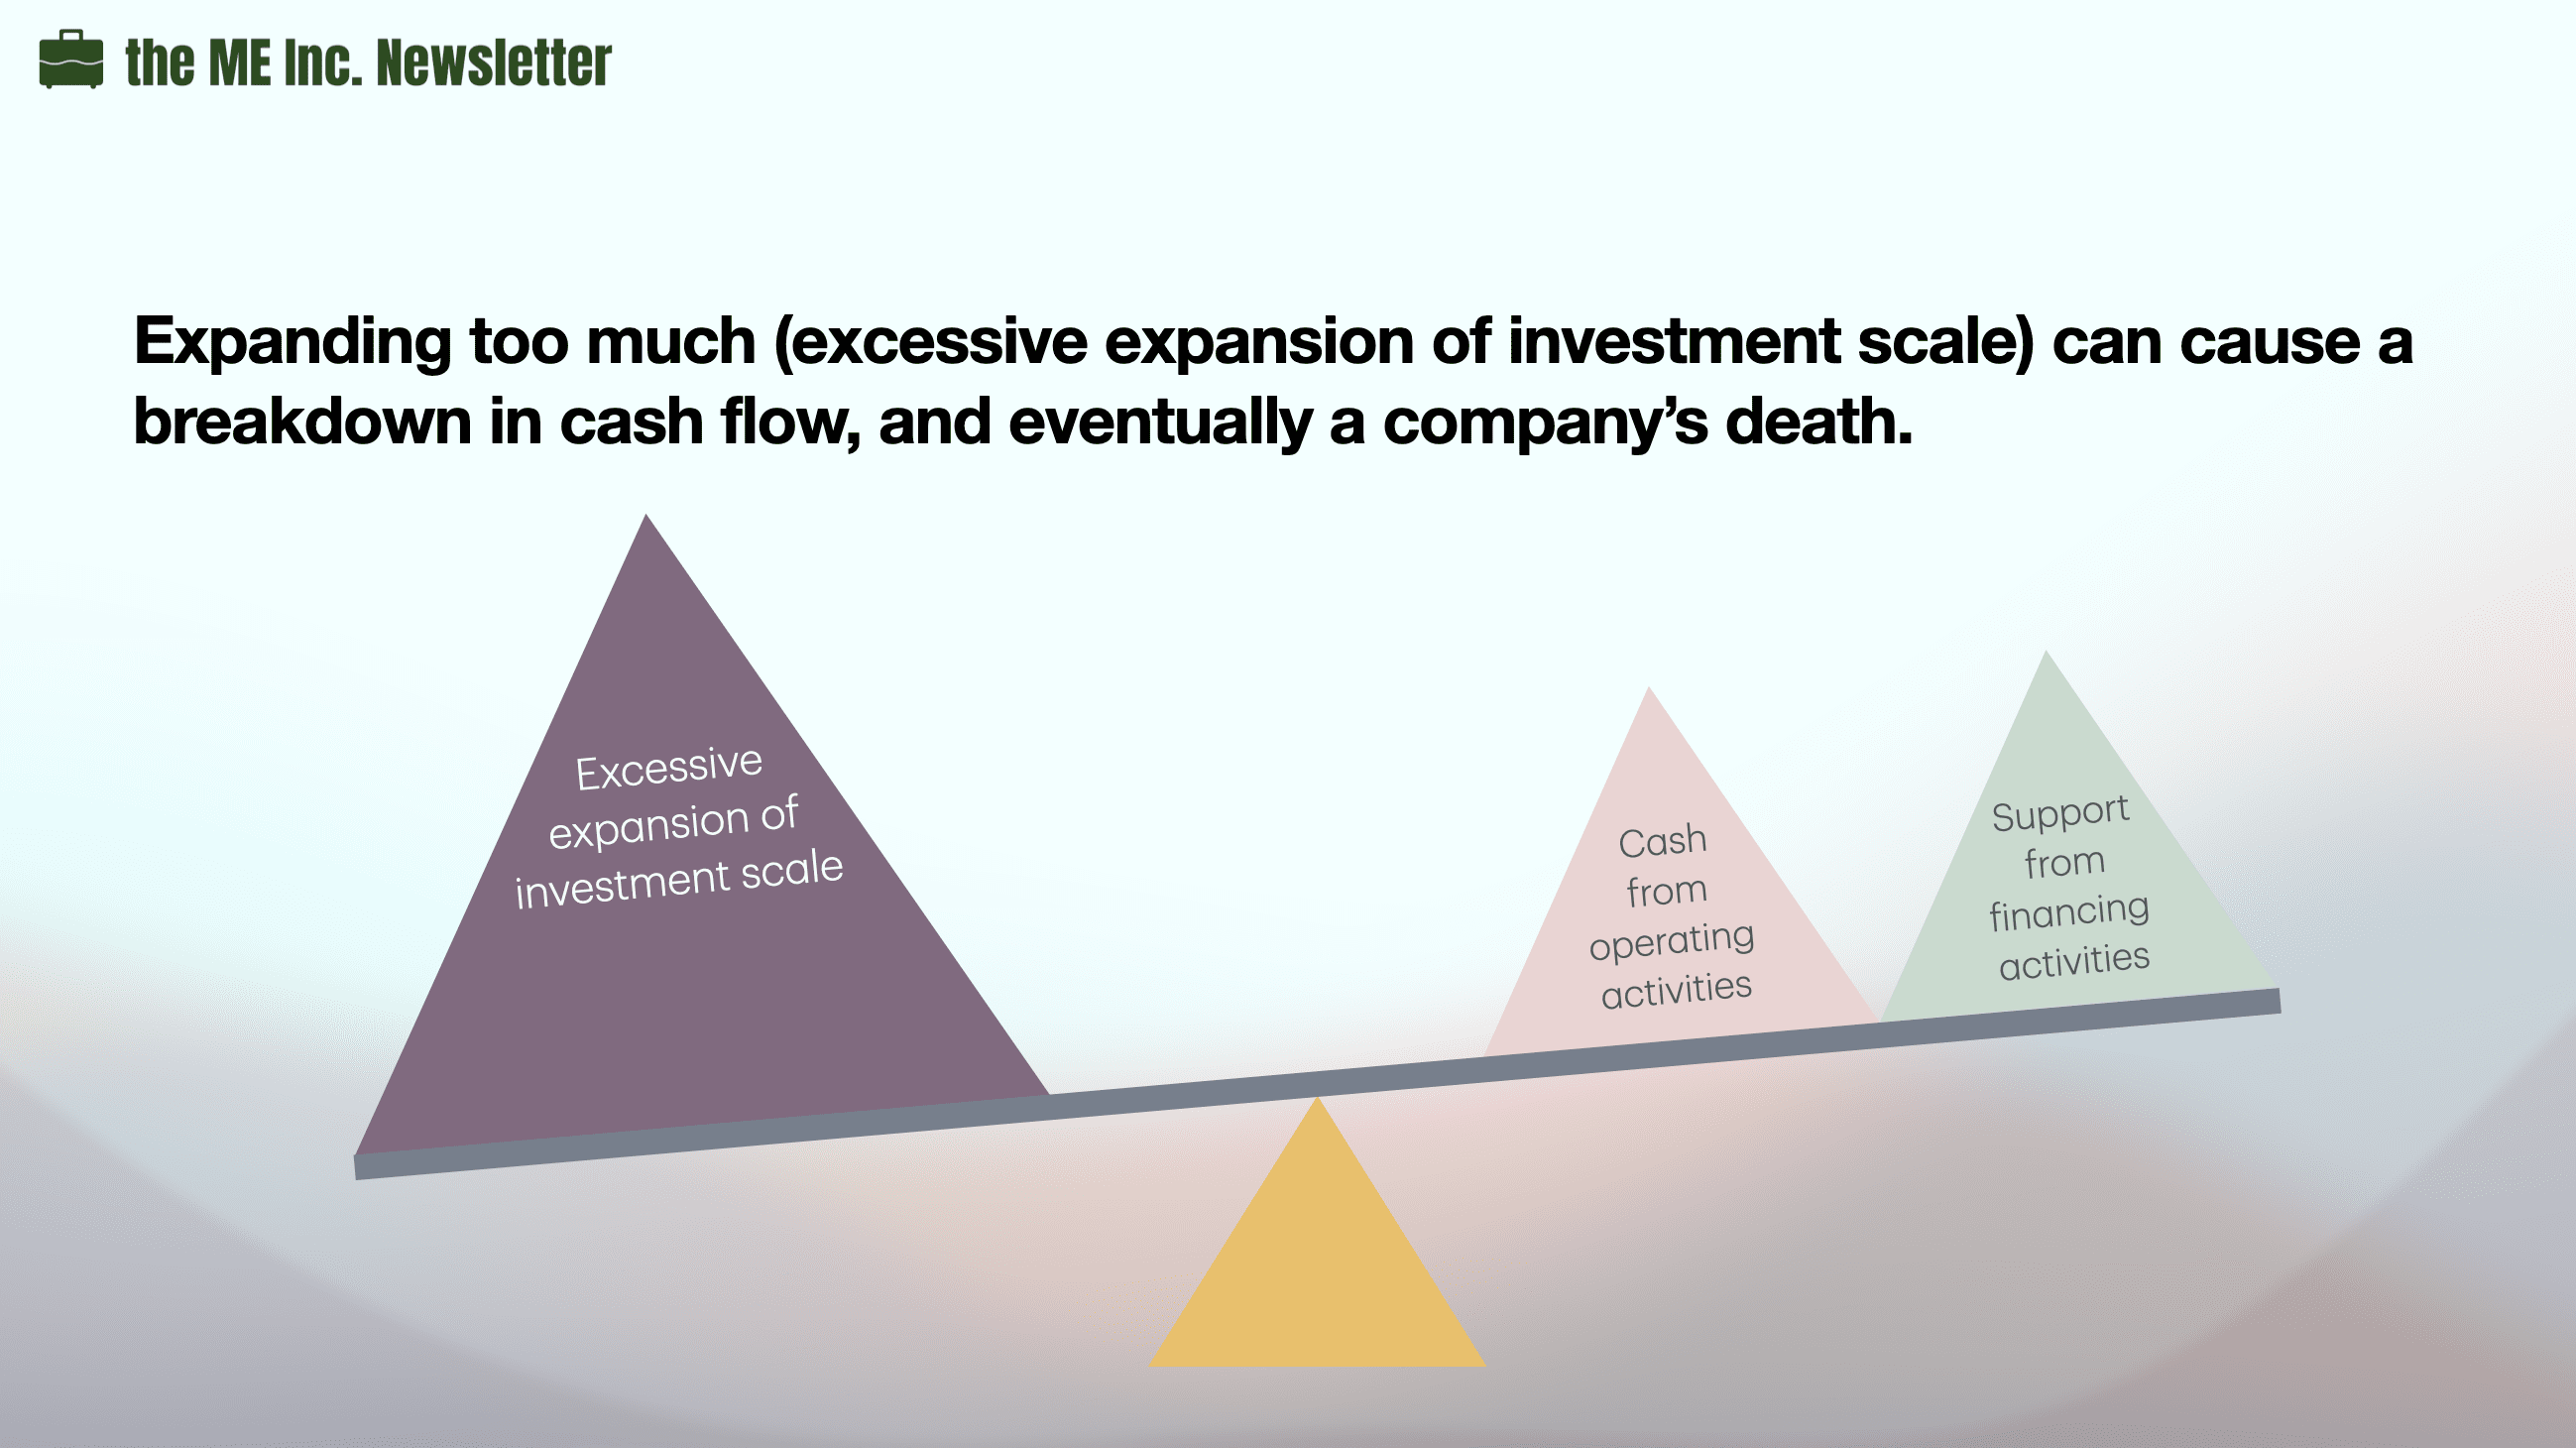
The reason is quite simple. The company expanded too fast by putting too much cash into investments. We know that investments will take time before they can generate returns. Before that, there is only cash outflow. Such cash outflow relies on cash flow from its own operating activities and its financing capability. If its investment expands too fast, it may lead to a situation where both operating and financing cannot generate enough cash to support such investment. The rapid outflow of cash could lead to a shortage of cash, and even drive an otherwise promising company into bankruptcy.
Therefore for a company with positive operating cash flow, negative investment cash flow, and positive financing cash flow, we should pay special attention to the company’s risk of investment. Such risk not only lies in the direction of investment, but also in how to effectively control the size and pace of the investment so that the company’s cash reserve can be kept within a reasonable range.
Sharing my learnings about the core skills on how to run life like a company in the Me Inc. Newsletter. Topics covered: Copywriting, Finance, Technology, and Productivity. Read my why here or join directly👇. No spams. Ever. – Michael
Welcome to the Me Inc. Newsletter.
Build yourself into a business, before you start one.
There is only one combination between the 4th and the 3rd combination, which is that this combination has a negative financing cash flow. In this case, the company is still paying back money.
Compared to a company with the 3rd type of cash flow, do you think this company has a higher or lower risk?
Well, it could go either way. It might have a higher risk because it has more areas to invest, in addition to paying back dividends or loan interests. It might have a lower risk, considering that it is already controling its leverage by paying back interests.
However, let’s think from the aspect of net cash flow.
If Total Net Cash Flow is Negative, Pay Attention to Investment
If at this moment, the company has a negative net cash flow, it means its cash is decreasing. Because an othewise healthy company can be driven to the edge of bankruptcy by cash flow breakdown, we should pay special attention to whether the company’s investments are growing too large too fast.
If Total Net Cash Flow is Positive, It’s All Good…(for the time being)
If its current net cash flow is positive, it means that the risk is kept within controllable range. Because cash flow from operating activities is the most reliable and stable source of cash, we rely on operating activities to support its investment and financing activities. And since there is extra cash, this company has the means to keep its risk under control.
But is operating activity reliable and stable forever? Well, not necessarily.
In 2008, China’s real estate market experienced such a change. In 2007, the whole market was booming, as the housing prices increased significantly. Despite the soaring price, there was still huge demand, and whenever a new apartment came onto market for sale, it sold out instantaneously.
In 2008, the real estate market suddenly cooled down after the global financial crisis happened. The whole process lasted for less than one and a half year. During this time, most real estate companies experienced slow sales, so their operating activities were negatively affected. The worst case scenario is that cash flow from the operating activities would become negative, and once they do, situations 1, 2, 3, and 4 will become situations 5, 6, 7, and 8.
Obviously, it is the last situation, where a company has a negative cash flow for all three types of economic activities. A company in such a situation will have only outflows of cash. If nothing changes, the company will eventually run out of money and go bankrupt.
A company with this combination of cash flow actually evolves from the 4th situation, where only operating cash flow was positive.
We mentioned that if the company with all negative cash flow in three types of economic activities doesn’t change anything, its cash will eventually run out and the company will be closed. But what kind of changes can it make?
The first option is to turn cash flow of operating activities to positive, or come back to the 4th Combination of cash flow.
The second option is to turn cash flow of investment activities to positive, or the 6th Combination of cash flow.
The third option is to turn the cash flow of financing activities to positive, or the 7th Combination of cash flow.
However, we know the 6th combination is hard to achieve. What this option shows is that even though I’m still making investments, these investments can quickly generate returns, which is a feat very difficult to achieve. A plausible way to achieve this is to sell these investments, which is the last outcome we want to see unless there are no other options.
From 8th to 4th: Turning Operating Cash Flow Positive Again
Then can we go from the 8th to the 4th option, i.e. at least turning our operating cash flow into positive?
Let’s revisit the real estate market downturn in China during the global financial crisis around 2008. During that time, many real estate companies started to heavily discount the houses they built, sometimes to as high as 30% off. The reason is that these companies wanted to collect cash as fast as possible in order to counter their shortage of cash, even at the cost of profitability. But it was only with such drastic discount methods that some real estate companies were able to turn their operating cash flow back to positive, saving them from bankruptcy.
Now that the company has managed to get out of the all negative cash flow situation and at least managed to return to a positive operating cash flow, its operating activities have become the main source of risk. Though we mentioned that its investment activities would still need to be monitored so investments wouldn’t grow too big too fast, the company should definitely protect its operating cash flow at all costs, as this is the only healthy cash flow it has. Without it, the financial situation of the company will soon enter into a downward spiral.
From 8th to 7th: Turning Financing Cash Flow Positive Again
How can it change to situation 7? To do this, we need to finance.
But during that period of time, the Chinese government launched a policy aiming at cooling down the real estate market, preventing banks from giving out loans to real estate companies for development. What this means is that if a real estate company wants to develop a new project, it won’t be able to secure any loans from the banks during that time.
To make matters worse, the China Securities Regulatory Commission also set forth a regulation preventing all real estate companies from going public during a specific period of time. Real estate companies lost all financing channels, either from equity of from debt.
To survive, some real estate companies started to borrow money from non-bank financial institutions such as some trust companies at much higher interest rates. This just shows how desperate some real estate companies were at the time, doing anything they can just to survive, even bearing the extra cost of capital. Of course, this ordeal didn’t last long, and after one year the real estate market became hot again. Although some companies went bankrupt, most of the companies overcame the difficulties after putting in all the efforts. However, we can easily imagine an otherwise different outcome; if the period dragged longer, many companies would need to start selling off their investments. If even after selling off investments, the companies still were unable to come up with enough cash, some might resort to bankruptcy.
As a matter of fact, in 2024 we indeed saw this happen, albeit 15 years later. Most real estate companies have encountered financial troubles, from Evergrande, Vanke, Wanda, Shimao, just to name a few. Evergrande has entered the bankruptcy process.
One major difference between 1 to 4 and 5 to 8 is that the first four combinations have positive operating cash flows. For companies with negative operating cash flows, what do you think would be the stage of lifecycle these companies are in?
Generally speaking, companies in the startup stage are more likely to have a negative operating cash flow. As these startups are still developing products and looking for product market fit, they are more likely to spend more than they make. Another possible scenario is when the market enters into recession. During this period of time, competition becomes so fierce that products just don’t sell.
Let’s first look at startups.
If a startup’s cash flow from operating activities is negative, how about its cash flow from investment? We all know that a start-up company needs to keep investing to grow bigger. After a startup makes investments, its investment cash flow should become negative.
If its cash flows from operating and investment are both negative, how can the company survive? Apparently, it needs financing, i.e. its financing cash flow is positive. This means a startup company normally has the seventh type of cash flow.
A company with this type of cash flow combination is likely one that has earned a large sum of money in the past and has a large cash position. Even though this company’s operating activities are not generating positive cash flows, the company’s past investments are generating positive cash flow, and it can consistently bring in money from the financial market. This company has a strong capacity in mobilizing capital from the financial market.
There are normally two possibilities for companies with this type of cash flow combination. The first possibility is that this company has a good investment project that is generating cash flow. In fact this project is so lucrative that it has enough returns to carry the company. Another possibility, rather an unfortunate one, is that the company is selling off projects. A company facing the second possibility is running out of cash and will likely close doors soon.
We can see that this situation rarely happens.
For this type of company, the key point is whether the company’s operating cash flow can become positive in a short time. When its operating cash flow becomes positive, the 6th combination will become the 2nd.
Sharing my learnings about the core skills on how to run life like a company in the Me Inc. Newsletter. Topics covered: Copywriting, Finance, Technology, and Productivity. Read my why here or join directly👇. No spams. Ever. – Michael
Welcome to the Me Inc. Newsletter.
Build yourself into a business, before you start one.
Now let’s revisit the paper manufacturing company that we have already analyzed before. Here we will take a look at the detailed financials of the company and do a pro-bono consulting work for its management. Our primary goal is to provide a few suggestions to the management team on future improvements, but not only that, we also want to provide support to creditors and shareholders and help them evaluate their investments into the company.
Background
If you recall, the year we did the analysis was 2002. In this episode, we want to discuss the situation two years later, or 2004. By 2004, this company had been operational in its industry for more than 10 years. When this company initially entered the industry, it upgraded some products by acquiring advanced technologies. This way, it obtained a foothold in the industry relatively quickly.
The company subsequently decided to focus on the following tactics. First, it seeks rapid expansion via mergers and acquisitions. Through agressive M&A activities and direct investments, the company quickly became the largest company in terms of production capacity in the industry. Second, the company also decided to actively explore international markets in addition to the domestic markets that it’s already in. Last but not least, the company also developed a wide range of products.
Our target company, throught its business decisions and executions, became the largest paper manufacturing company in the industry. To gain a fair understanding of the company’s performance, it’s only logical to compare it with the second largest company instead of the industry average. The comparison company actually has some huge differences from this company. The most noticeable difference is that this company has a homogeneous product line with relatively few selections. Later, we will show how the product lines of these two companies are constituted.
In addition, the target company invests in various aspects of the industry such as raw materials. In previous discussions of the paper manufacturing industry, we mentioned that the supply of raw materials in China is relatively short because of limited forestry resources in the country, and many raw materials such as wood pulp and waste paper pulp need to be imported.
The company actively explores various sources of raw materials. On one hand, it built many raw material production bases, including a 30,000-ton reed pulp base, a 50,000-ton wood pulp base, and a 50,000-ton poplar wood pulp base. On the other hand, it also cultivated a 666.7 square kilometers poplar forestry. In other words, the company actively attempts to solve the raw materials shortage problem by planting trees and boosting its pulp production capacities. Later it also took over another company with an annual production capacity of 300,000 tons of pulp.
In summary, the target company engaged in numerous business activities in the past few years, activities such as large-scale expansions, mergers and acquisitions, product line expansions, and vertical integration, i.e. building production bases of raw materials. Although the company is rapidly expanding its scale in the market and constructing its production bases, the company’s financial data is not very optimistic. Let’s take a look.
We already know that the primary benchmark to evaluate a company is its ROI, specifically, the return on total assets. The target company only has a 3% ROA, a number even lower than bank’s deposit interests. Therefore, without making further calculations, we know that the company’s return on investment is below its cost of capital.
The company that we compare our target company with has a 7% return on total asset, even though this company is only regional. Clearly, the target company lags behind significantly in terms of return on investment.
Why, exactly, is its return on investment so far behind that of its competitor?
Cost Analysis
Although the company is quickly developing in the market, its financial data are not optimistic. The company’s return on investment is only 3%, which is far behind the 7% return enjoyed by its opponent. What is the reason for this situation? We know that return on investment is determined by two factors. One is the company’s effectiveness and the other is the company’s efficiency.
First, we will examine effectiveness. The net profit ratio of our target company is 7%, whereas that of its competitor is 10%. It is clear that our company’s effectiveness lags behind that of its competitor.
Next, we will examine efficiency. The company’s total asset turnover ratio is 0.45, whereas its competitor’s is 0.7. It is clear that from the perspective of efficiency, this company also lags behind the competitor. From our previous lessons, we know that a company will normally make trade-offs between effectiveness and efficiency when setting its overall strategy. However, for this company, what we see is that both effectiveness and efficiency lag behind. A lagging effectiveness plus a lagging efficiency has caused a less satisfying return on total assets for the target company. Therefore, the next step is to find out why this has happened.
Let us first look at the effectiveness. We know that the most important factors that determine a company’s net profit ratio are costs and expenses. This is the company’s cost and three of its expenses in 2004. Specifically, we want to examine the proportions of operating expense, management expense, and financial expense relative to its revenue.
First of all, we will examine cost. We find that from the perspective of costs, there is no difference between the company and its competitor; the costs of our target company and those of its competitor are both 76%. This figure seems to indicate that the problem of the company’s poor effectiveness is due to higher expenses rather than costs. However, this may not be the case.
If you recall, the paper manufacturing industry is highly capital intensive and requires a great deal of fixed asset investments. Theses fixed asset investments mainly involve equipment, meaning that the company’s production costs contain relatively more fixed costs. When a company’s production cost contains costs that are relatively more fixed, economy of scale exists. An industry with economy of scale will see a decreasing unit cost of fixed assets with the increase of production. The more products are produced, the lower the unit cost of fixed assets.
Now let’s examine the production capacity of these two companies.
We can see that production capacity is approximately 1.5 million tons for the target company and approximately half a million tons for the competitor. That is, the production capacity of the company is approximately three times that of its competitor. Knowing this, it is nature to assume that the target company will have economy of scale over its competitor simply because of its size. Our target company SHOULD have a cost advantage.
However, for a company with production capacity three times that of its competitor, we actually don’t see the expected cost advantage, which is reflected in the equal percentages of cost over revenue for both companies.
So, what could be the problem?
Let’s further examine the product lines of these two companies. From the table above, we can clearly see that the target company’s product line is much more diverse than its competitor’s. Its products include writing and printing paper, newsprint paper, and cardboard paper. With respect to the writing and printing paper, the company also makes different products, including light-weight coated paper, offset paper, writing paper and art paper. Its competitor only produces two types of paper: newsprint and cultural paper. In addition to the company’s diverse product lines, the size of each product line is actually not very large. Among the various products, we see that only art paper is relatively large with a similar size of the competitor’s newsprint product line.
The paper manufacturing industry has an important feature: each line of product needs a specific set of equipment, which can only produce this specific type of product. Logically, the economy of scale cannot be achieved by a bigger company size, and can only be achieved by a bigger product volume for that specific type of product.
By now we should be able to understand why the company failed to achieve a lower cost structure despite of its size. Even though the company’s production capacity is three times as large as its competitor, it actually achieved such capacity via product line expansion, and no single product’s volume is significant enough to achieve true economy of scale. This is the reason why the target company does not have a cost advantage over its competitor in this capital-intensive industry.
This table lists the cost structure for producing one ton of paper in different regions of the world. In China, the cost structure of paper manufacturing is relatively special. China has a distinct advantage in labor cost, and a disadvantage in the cost of raw materials. For a paper manufacturing company, this means that in addition to fixed costs, costs of raw materials also make a material impact to its cost structure.
Our target company has been building raw material production bases and cultivating forestry for some time. It not only has built and acquired production bases, but has also planted trees on a very large scale. The company has done quite a lot of work to combat the shortage of raw materials. The company should have exhibited a clear cost advantage after all the work.
Yet from our discussions above, we know this is not the case. The reason is actually quite simple; although the company actively builds raw material bases, trees will take considerable amounts of time to grow to maturity, after which trees will have to be harvested and processed into pulp. It will likely take quite some more time before all the vertical integration efforts can be reflected in the company’s costs.
On the other hand, how does the competitor perform? This competitor has two primary products, newsprint paper and cultural paper. Newsprint paper is usually not produced from wood pulp but from reed, and there are abundant reed resources in the local region. The competitor has been able to utilize such local resources to maintain a reasonable raw material cost.
In summary, our target company has engaged in a great deal of vertical integration; it vigorously plants trees, develops pulp bases and acquires production capacity. Its competitor, on the other hand, solves the problem of insufficient raw materials by using alternative raw materials. They also differ in their product line strategies. Our target company has a multi-line strategy, further diluting its chance to achieve economy of scale, while the competitor has a much narrower selection of products.
Expense Analysis
Let’s revisit this table illustrating all the costs and expenses. In this table, we also list the proportion of each expense relative to revenues. Clearly percentage wise, all three expenses of the the target company are higher than those of its competitor.
Let’s start with financial expenses.
Financial Expenses
Clearly the target company has more debt financing than it competitor does. This company has taken out both short and long term loans, and has also issued bonds. Overall, all of the company’s interest-bearing liabilities account for 44% of its total assets, whereas the same categories of liabilities only acount for 19% for the competitor. Because the company has more interest-bearing liabilities, its financial expense is significantly higher than that of the competitor.
Here we see that to support a production capacity approximately three times as large as that of the competitor, the company needs to invest more in this capital-intensive industry, where a production capacity of approximately 10,000 tons requires an investment of 100 million CNY. Considering that the target company has 1 million ton more capacity than the competitor, it likely has invested 10 billion CNY more than the latter. Such a huge amount of investment is likely the reason why the target company has to resort to debt financing more than the competitor does.
Operating Expenses
Operating expenses include expenses related to sales activities such as advertising, salary of sales team, commissions and bonuses, as well as freight and storage fees incurred during the sales process.
As part of its expansion strategy, the target company established many sales subsidiaries located across the country, covering most of its major markets.
From this table, we can see that over 38% of the company’s sales are from eastern China, followed by northern China. The markets in these two areas account for 60% of the company’s total revenue. The raw material bases, on the other hand, areprimarily concentrated in northeast China and Inner Mongolia, creating a major mismatch between its own supply and demand. So even though the target company established a great deal of production capacity, such capacity are NOT located in the company’s major markets. The company has to spend a great deal of resources to transport raw materials to production bases, and from production bases to major markets. As a matter of fact, transportation accounts for 75% of all operating expenses, or about 4% of the company’s revenue.
Management Expenses
Management expenses, or administrative expenses, account for about 5% of revenue, higher than the 3% of its competitor.
The reason is that in the past several years, the company engaged in many mergers and acquisitions, gradually becoming the largest integrator in the industry. When a company acquires another company, it not only acquires its physical assets, but it also takes in that company’s personnel. The success of any M&A depends largely on whether the personnel of the acquired company can successfully integrate with the buyer. Even for many well-known companies, such integration could be extremely challenging, which can cause the failure of an otherwise successful M&A deal.
This could be a major reason why the target company has a higher administrative expense. Before the company can achieve actual integration after the M&A deal, the company might have a higher administrative expense than its competitor.
Turnover Analysis
Analyses of cost and expenses are from the aspects of effectiveness. Now let’s move on to efficiency.
It is apparent that the company also lags behind its competitor on efficiency; its total asset turnover ratio is only 0.45, while that of its competitor is 0.7. To know why the company’s total asset turnover ratio is lower than that of its competitor, first we must understand what are the company’s largest assets, and what the turnover ratio of those assets are like.
First, we want to know what the company’s largest assets are. A simple way to do this is to conduct a common-size analysis on the balance sheet.
Through common size analysis, we will be able to know a company’s asset structure, which leads us to the company’s largest assets. Upon locating these assets, we then identify those that contribute the most to a company’s low asset turnover ratio. The reason is that the total asset turnover ratio is actually determined by the weighted average of turnover ratio of each asset item, where the weight is the proportion of an asset item relative to the total asset. Therefore, our first step is to identify the structure of a company’s assets.
In this common-size analysis, we can easily see that fixed assets are the company’s largest, accounting for 65% of the company’s total assets. Its competitor also exhibits this type of feature, where its fixed assets account for 70% of the competitor’s total assets. Both companies have exhibited the capital intensity of the paper manufacturing industry. Other than fixed assets, both companies have similar levels of accounts receivable and inventory. These three assets alone, for both our target company and its competitor, account for more than 80% of total assets. In other words, if we can understand the differences between the turnover ratios of these three assets between the two companies, we should be able to find out why our target company has a lower total asset turnover ratio.
Fixed Asset Turnover Ratio
Fixed assets are further divided into two parts, finished fixed assets and construction in progress. Even though our target company has a lower level of fixed assets than that of its competitor, it actually has more construction in progress. 28% of the 65% of fixed assets are actually construction in progress, while its competitor only has 14% out of the 70%.
Why does this matter? Well, we know that fixed assets under construction can not be put to use. Therefore, it is impossible for them to generate revenue for the company. However, they still need to be accounted for in fixed assets; so construction in progress are essentially fixed assets with ZERO turnover, since they generate ZERO revenue. This is a major reason why the target company’s turnover lags behind.
Inventory
Next let’s look at inventory of both companies.
We find that the company’s inventory turnover ratio also lags behind its competitor. Why is that? Let us look at the types of inventory involved.
On this table, we see that inventory can be divided into two categories, raw material and finished goods. The largest portion of inventory for the target company is not finished goods, but raw material.Furthermore, relative to the previous year, there was a substantial growth in raw materials within just one year, increasing by more than 400 million CNY. Clearly, our target company was hoarding raw materials.
Why was it hoarding raw materials? Well because of the shortage of raw materials, prices of raw materials are almost always rising. The company could be hoarding just to prevent price fluctuations. But since raw materials cannot generate revenue before they are further processed, they will drag down the overall inventory turnover ratio.
Accounts Receivable
The target company’s accounts receivable ratio is actually not bad, even though it is still lower than that of the competitor. There could be some factors such as that the company might have adopted loose credit sales policies in order to move products faster. Another reason might be because the company has a wider variety of products.
However, will its more accounts receivable, coupled with a relatively lower accounts receivable turnover ratio, bring higher risk to the company? Let us look at the company’s account receivables.
For the year 2004, 85% of the company’s accounts receivable were likely within a year old. From this perspective, we believe that the company’s accounts receivable are relatively safe.
This is our analysis of the company’s turnover ratio. There are mainly two reasons why the company lags behind its competitor in efficiency:
The company has more projects under construction, and is at a stage of rapid expansion.
The company is taking measures to reserve raw materials, which will result in a relatively low inventory turnover ratio.
Recap of the Target Company’s Current Status
Reasons the Target Company Lags on Effectiveness
Our target company lags behind its competitor on both effectiveness and efficiency, even though it is much larger in terms of production capacity.
We find that the company lags behind the competitor on effectiveness for the following reasons:
As a large-scale paper manufacturer, the company does not enjoy the cost advantage that should be present in an industry with economies of scale. This is primarily because this company adopts a multi-product strategy, none of which has a significant scale.
Over the past several years, this company has started building production bases of raw materials, including planting trees and acquiring pulp production capacities. Planting trees, a slow process by itself, will not yield an effect on the company’s costs within a short period of time.
The company’s relatively large scale results in a very high financing requirement in this capital-intensive industry, causing high financial expenses.
The company’s raw materials, production bases, and major markets are not located in the same region, forcing it to pay high transportation fees, which is a type of operational expenses.
The company’s rapid mergers and acquisitions during the past several years also pose great challenges to company management, and whether the company can effectively integrate its acquired companies is still unknown, potentially causing higher administrative expenses for the comapny.
Reasons the Target Company Lags on Efficiency
Unfortunately, the target company also lags behind it competitor on efficiency, for the following reasons:
The target company have many fixed assets under construction and these projects do not generate revenue, lowering the fixed asset turnover ratio.
The target company has been engaging in hoarding raw materials, more than doubling the total inventory within a year. However, raw materials cannot generate revenue while they are only stored in warehouses, thus lowering the inventory turnover ratio.
Judgment for the Company’s Future
What do you think of the target company’s future after knowing everything?
To help you with the judgment, let’s first examine the market environment. We know that China’s paper manufacturing industry was growing fast up until 2008, after which the industry transitioned into a stage of excess capacity. The year of 2004 was only four years away from 2008, meaning that companies in the paper manufacturing industry had four years to prepare for such a highly competitive environment.
Another dynamics that was always present was the shortage of raw materials, and companies would have to rely on imports. Consequently, the price of raw materials was always rising.
Other than exisitng competitions from the industry, companies in the industry also face the threat of substitute products.
Do paper products have potential replacements? Well, it depends on the exact type of paper we are discussing. For example, household and packaging paper are unlikely to be replaced. Even though we can use non-paper wrappers as replacements for packaging paper, the general trend of packaging paper consumptions is still moving up with the level of economic development.
Newsprint paper and writing and printing paper are facing quite different situations. Over the past two years, paperless reading on devices such as iPad, Amazon Kindle, and smart phone has become increasingly popular. The popularity of these items has caused a large reduction in paper-based media. In particular, newspapers and magazines are impacted the most.
Knowing the general market trend and environment, we might see things differently for the company’s multi-product strategy. Even though the target company wasn’t able to achieve economy of scale as a result of its multi-product strategy, it might be in a better position to deal with changes in the market. For example, the possibility of demands of all of its products going down at the same time is fairly rare. In contrast, the main products of its competitor, newsprint and cultural paper, are most seriously impacted by paperless reading, rendering it less prepared to face future market changes.
In addition, even though the target company’s vertical integration activities have not yielded cost advantages for the time being, the raw material bases and self-planted forestry will msot likely play a role in the future. The competitor, though not worrying about the high fixed costs at this moment by adopting the alternative approach of using reed pulp, will not be worry-free. Since paper manufacturing from reed pulp pollutes heavily, a more strict environment protection requirement could render such method cost-prohibitive.
A company’s lack of cost advantage may not be fatal when competition is not fierce. For example, when the average gross profit ratio is 30%, a 5% higher than average cost will cause reduce a company’s gross profit ratio to 25%, which is not life or death. However, when the overall industry competition becomes more and more fierce to the point where the industry’s average gross profit ratio is 15% or lower, a 5% difference could make a huge differece. As the industry becomes more and more competitive, we can expect cost to play an ever increasingly more important role in industry dynamics.
Our target company has not only built raw material production bases but has also reserved raw materials, so it’s ready to face the fluctuation of raw material prices. However, the size of its production capacity naturally requires the company to always be prepared to raise more capital. Additionally, the company’s production, supply, and markets do not match, so it urgently needs to correct such mismatches. And it will need more time to digest the extra administrative expenses caused by its merger and acquisition activities.
The low turnover ratio of fixed assets is primarily because the company is now at the expansion and construction stage and has many projects in progress, which cannot generate revenue until they are finished. As these projects in progress are gradually completed, the turnover ratio of fixed assets will return to a normal level.
The company’s inventory turnover ratio is relatively low due to its hoarding of raw materials. However, hoarding of raw materials might provide the necessary cost effectiveness in the future. So from the perspective of future development, this company is not in a bad situation.
On the surface we might be inclined to conclude that the target company is in trouble in the year of 2004; but after our in-depth analysis, we have found that there are still many things to anticipate for the target company. Its many past measures have laid a good foundation for its future, although its management still faces many challenges.
Let’s look at the financial data of the two companies in 2008.
Recall that 2008 was the year for the Chinese paper manufacturing industry to enter excess capacity; competition began to emerge. Clearly, we see that after four years, all of the target company’s the financial indices have significantly improved. This result is consistent with our previous analysis. In addition, we have just mentioned that the competitor might have a problem that its primary product, newsprint, could suffer from the ever more popular trend of paperless reading. Moreover, since the competitor does not have considerable reserves of raw materials, its costs are more susceptible to increase.
Three years after 2008, or 2011, the fierce competition has rendered the competitive environment totally different for the two companies. The competitor’s net profit ratio in 2011 dropped to only 0.7%, at the brink of loss.
The target company has a gross profit ratio of 16%, 4% higher than that of its competitor. In a highly competitive industry like paper manufacturing, 4% could make a huge difference on the life or death of a company. It is also because of this difference, the target company still turned in a relatively good performance. The subsequent development of the company is consistent with some of our previous judgments.
Just now we discussed what is making money. In the short term, making money means having positive economic profit. In the long term, it means creating value for shareholders.
The amount of value created for shareholders is determined by the difference between the return of invested capital and cost of capital. If we want to make improvements in our company, we should, on the one hand, increase return on invested capital, and on the other hand, think of ways to lower cost of capital. Normally cost of capital is related to the industry and the capital structure, so we won’t put too much energy on this topic. Instead, let’s examine return on investment, or ROI.
Although return on invested capital is a more accurate indicator to return on investment, it actually has the same economic meaning as return on total asset. To simplify the issue, we will still use return on total asset for the following discussions.
You may remember that return on total asset is determined by two factors, effectiveness and efficiency. Effectiveness is represented by net profit ratio. Efficiency is represented by total asset turnover. And Return on Total Asset is the product of effectiveness and efficiency, or net profit ratio and total asset turnover.
Whether a company chooses to prioritize effectiveness or efficiency is a matter of strategic choice. There are two types of strategic choices: one prioritizes effectiveness over efficiency, called differentiation strategy, and the other vice versa, called cost leadership strategy. A company would normally make a strategic choice voluntarily by taking into considerations of the trade-offs. Of course, once a strategy is chosen, there is also the matter of strategy implementations.
Some investors may argue that they should only care about return on equity (ROE) and not return on total assets (ROA), for the reason that shareholders should only care about their part of the returns on capital. Why should they care about the return on capital for creditors?
To solve this issue we will need to understand the relations between ROA and ROE.
ROE is net profit divided by shareholders’ equitites.
Let’s assume that I don’t know the value of shareholders’ equities, but I do know that of total asset. Obviously I cannot get ROE, but I can get ROA. If I want to get ROE, I have to multiply ROA by another ratio, called total asset divided by shareholders’ equities. In this way, the two total assets will be crossed out, leaving us with net profit divided by shareholders’ equities.
Here we see this new multiplier, total asset divided by shareholders’ equities, for the first time. However, even if it is new, it’s actually closely related to another term we’ve already come across before, called debt asset ratio.
Recalled that debt asset ratio is calculated by dividing debt by total asset. In addition, one of the most fundamental equations in accounting is that total assets alway equal to the total of liabilities and shareholders’ equities. Combining both, we will get to the following equation:
Now. let’s assume that the total asset of a company remains the same but its liabilities have increased. We know that the debt asset ratio will increase. Once we subtract debt asset ratio from 1 and then invert the result, we will find an increased value for total assets divided by shareholders’ equities. That’s why we said this number is closely related to the debt asset ratio; they move in the same directions, i.e. they are positively related. The higher the debt asset ratio, the higher the indicator. Because it describes the number of times total asset is over shareholders’ equities, it is often referred to as equity multiplier.
Now we know ROE equals to ROA times equity multiplier. If I were a shareholder who wants to increase the ROI of shareholders, I have two ways to achieve my goal. One way is to increase ROA, and another way is to raise the debt level of the company in order to increase equity multiplier. As a matter of fact, raising the debt level seems much easier than raising the ROA. As long as I keep borrowing more money, my ROE will increase. That sounds easy.
However, a prerequisite of this claim is that when raising the equity multiplier, our ROA must stay the same so the product will also increase as a result. Let’s see if that could actually happen.
If I borrow money and just put it in the bank, what’s going to happen to my net profit? Obviously, because the interest rate of deposit is always lower than that of loans, my net profit will decrease. And because borrowing doesn’t affect my shareholders’ equities, the ROE of my company will decrease as a result.
However, no companies should only borrow money to put it in the bank. Money must be put into work, i.e. investment. But does investment always make money? Not necessarily. It may cause losses, or maybe even more losses than depositing it in the bank.
What does this mean? It means although seemingly there are two ways to increase returns on investment of shareholders; one is to raise ROA, and the other is to increase equity multiplier. The two ways are actually leading to the same result.Even if I decide to borrow more money, I still need to solve the second problem, which is to use borrowed money to make more money.
From this perspective, we see that the fundamental factor that determines return on investment for shareholders is not how high your debt asset ratio is, but how much the return on investment is for the company as a whole, aka. ROA. For a good company, the most important thing is to create value, which is equivalent to increasing ROA. This is also important to shareholders since the fundamental factor determining the return on investment of shareholders is still the return on investment for the company as a whole, or the ROA.
For all the terms and formulas we’ve covered regarding how to evaluate the quality of a company, visit this link.
Sharing my learnings about the core skills on how to run life like a company in the Me Inc. Newsletter. Topics covered: Copywriting, Finance, Technology, and Productivity. Read my why here or join directly👇. No spams. Ever. – Michael
Welcome to the Me Inc. Newsletter.
Build yourself into a business, before you start one.
Learn. Grow. Build. Now.
function ml_webform_success_14362251() { var $ = ml_jQuery || jQuery; $(‘.ml-subscribe-form-14362251 .row-success’).show(); $(‘.ml-subscribe-form-14362251 .row-form’).hide(); } fetch(“https://assets.mailerlite.com/jsonp/918262/forms/119753320103413631/takel”)